18.05.15
In April 2015, NASA terrestrial observatory published a map showing lightning activity on our planet with the help of data collected by multiple satellites from 1995 to 2013. Two areas are most often exposed to the elements: the north-west of Venezuela and the Democratic Republic of Congo.
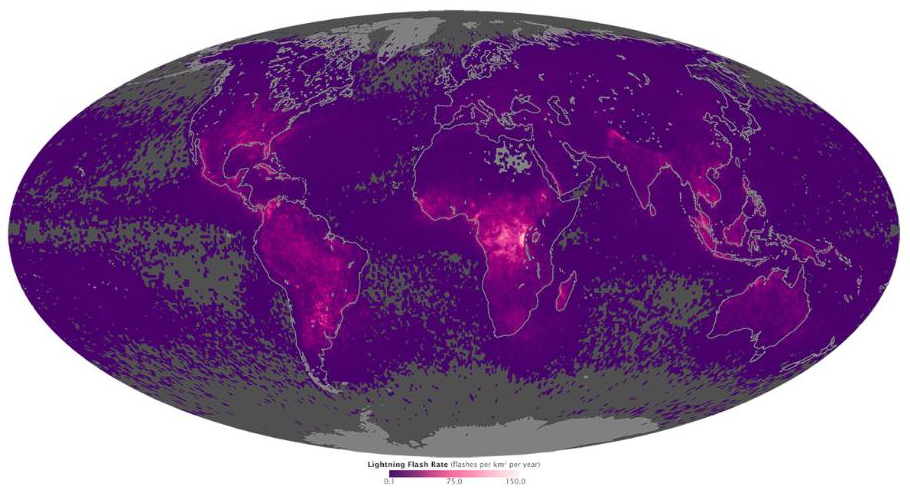
This map shows lightning frequency, identified by the number of flashes per square kilometer per year. Areas with the lowest number of lightning flashes are marked in gray and dark purple; areas with the highest number of lightning flashes - up to 150 per year per square kilometer - in bright pink. You can see the interesting relationship between severe weather and our planet on the map. For example, lightning flashes often occur above the solid ground than above the water surface. According to the NASA representatives, it happens because the hard surface (ground) absorbs sunlight and heats up faster than water; and this, in its turn, means stronger convection and greater atmospheric instability, leading to the formation of thunder and lightning.
You can also see that the lightning is more common near the equator, which is due to stable warm temperatures and convection in the region.
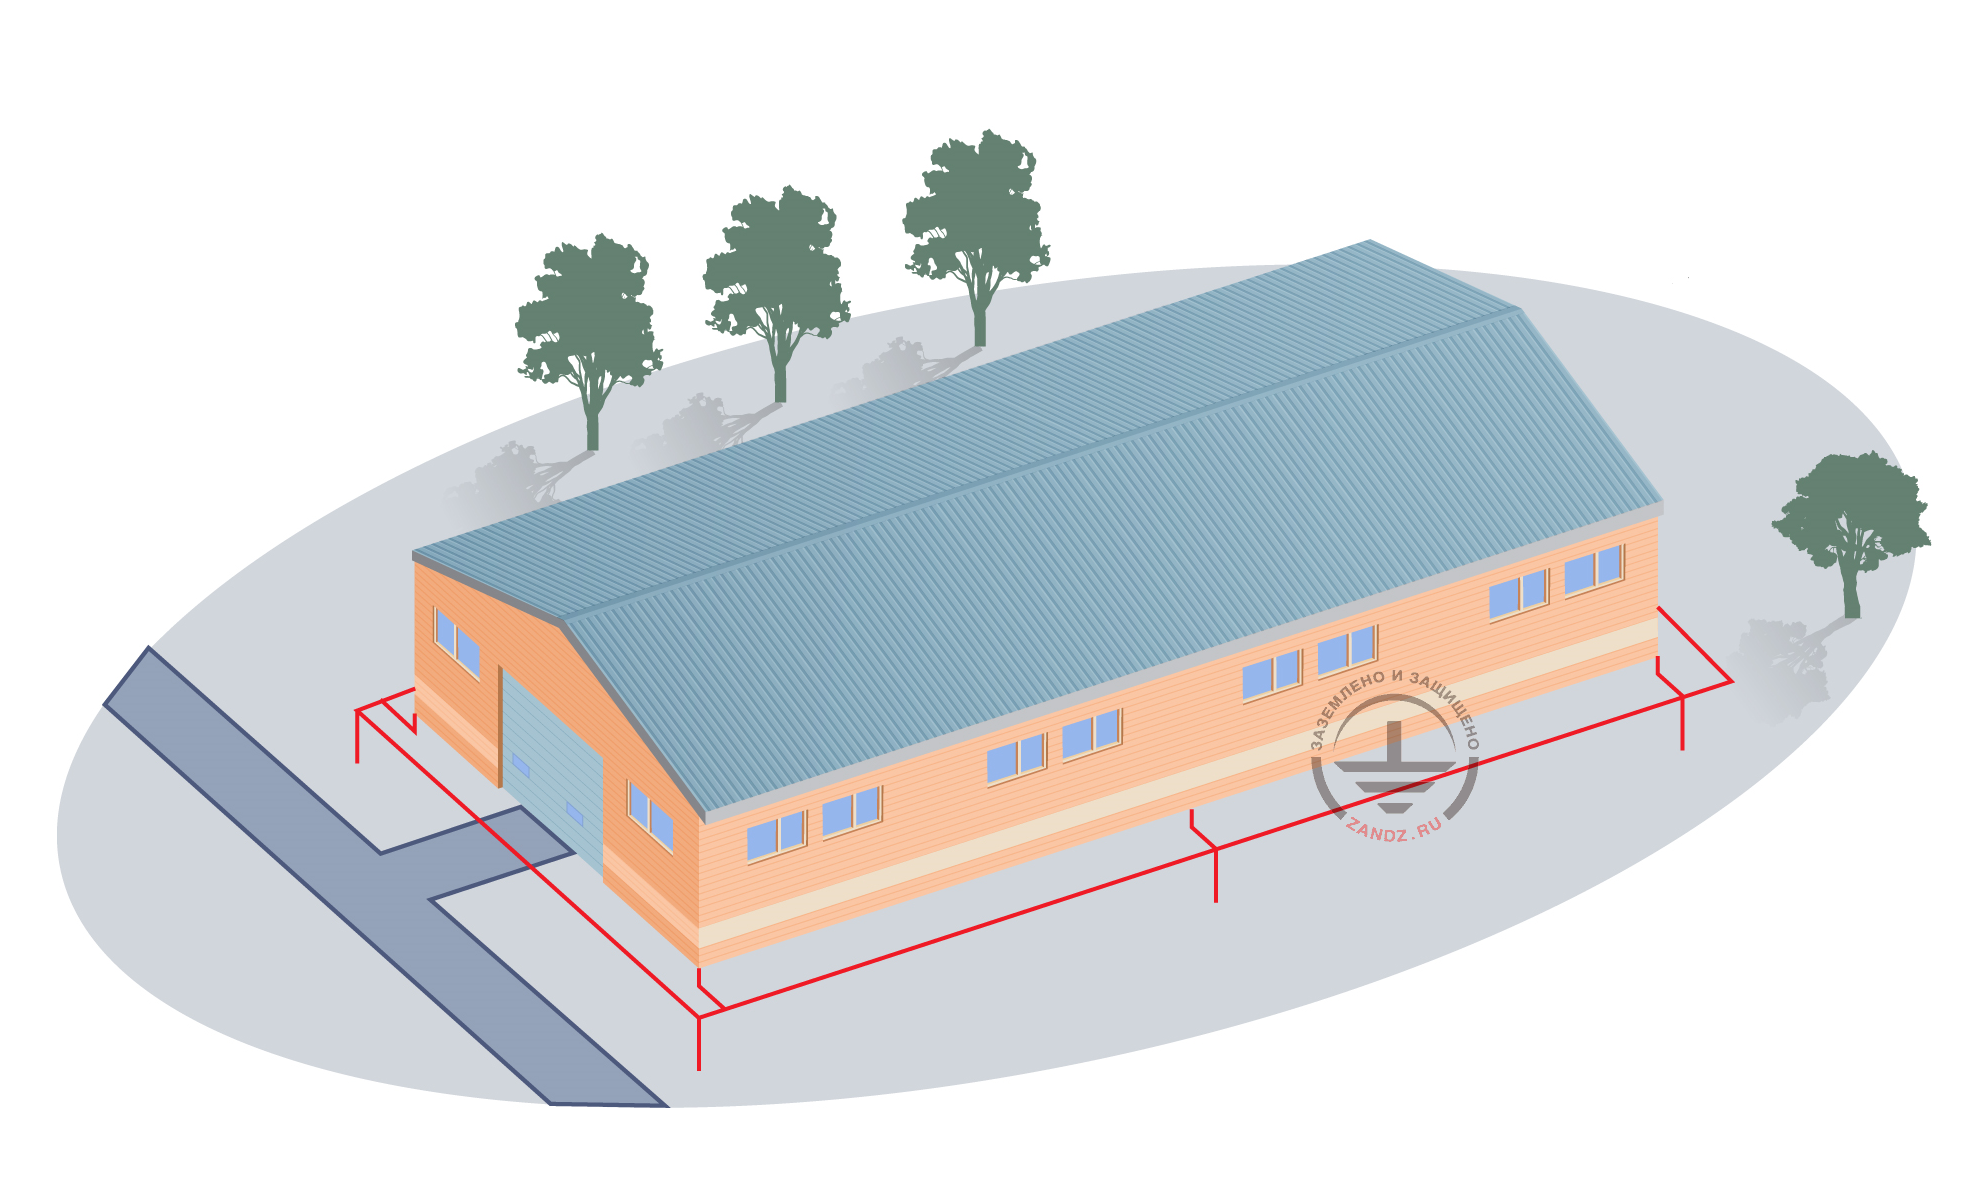
The terriroties of Russia and the nearest countries were left without bright pink marks, but that does not deny existence of thunderstorms in these regions. There are "enough" problems from it and it must be taken into account in the design and construction of any residential and industrial facilities. Read more about the elements of lightning in Russia and lightning protection on a separate page.
Cases of being struck by lightning happen every day. They often lead to disastrous consequences. To avoid this, it is necessary to carry out a complex of measures for lightning protection. Do not put off your safety till tomorrow!
Links to help:
Related Articles:
.png)