Webinar
The second webinar from series “Electric energy saving and quality improvement” series
Webinar text. Page 3
|
Выбор подхода |
Approach selection |
|
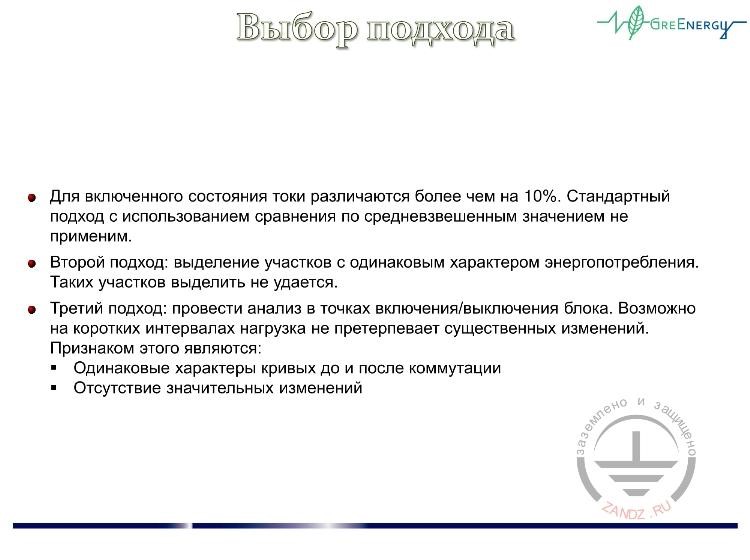
Для включенного состояния токи различаются более чем на 10%. Стандартный подход с использованием сравнения по средневзвешенным значением не применим. |
The current differs by more than 10 % for the On status. Standard approach with the use of comparison by average weighted values cannot be applicable. |
|
Второй подход: выделение участков с одинаковым характером энергопотребления. Таких участков выделить не удается. |
The second approach: distinguishing the intervals with similar power consumption pattern. No sectors like this can be distinguished. |
|
Третий подход: провести анализ в точках включения/выключения блока. Возможно на коротких интервалах нагрузка не претерпевает существенных изменений Признаком этого являются: |
The third approach: perform analysis for the unit On / Off points. Possibly, the load shows no considerable changes in short intervals. The indications thereof are following: |
|
Одинаковые характеры кривых до и после коммутации |
Similar curve patterns before and after switching |
|
Отсутствие значительных изменений |
No considerable changes |
Approach selection
- Now let us consider the choice of approach again. When the current is switched on, they differ by more than 10% - it does not pass, the isolation of the section fails. That is, we move sequentially. Did we manage to find intervals by means of average or weighted average? No, we didn’t. We managed to isolate transitions when we have transitions by transition, and then in percentage terms, to allocate the remaining sections at intervals. Such intervals can not be made. What is left? There is a third approach left. We say that we will compare points and look for representative points. Why more intervals? There are more switching points. Otherwise, it turns out that when we made four points, it may not be a single representative one. There is no need to be lazy, so as not to do repeated tests. So: the same characters and no significant changes.
|
Анализ результатов |
Analysis of the results |
|
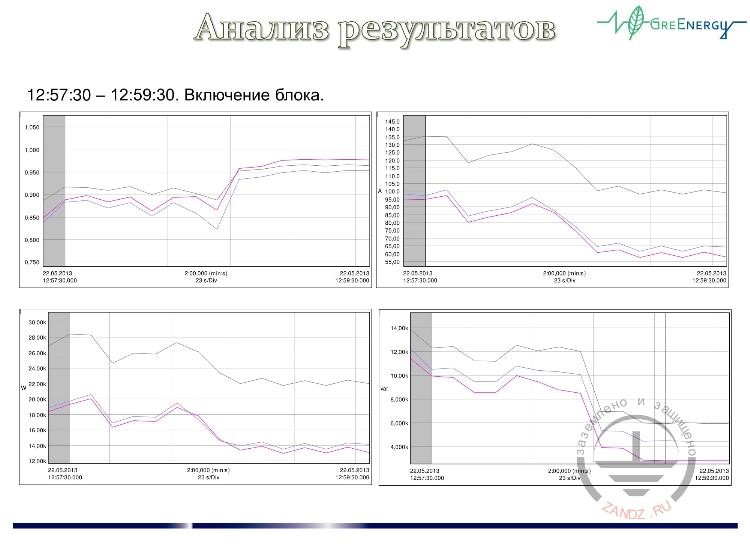
Включение блока. |
Unit is turned On. |
Analysis of the results. Unit switching on
- There are few points for analysis. Unit switching on Here the moment of switching, it is clear. We are talking about the fact that in our country the reactive power dropped, that before switching we had the same curves, and after switching their inclination differs.
The point cannot be considered representative, and the interval blurring is quite significant.
|
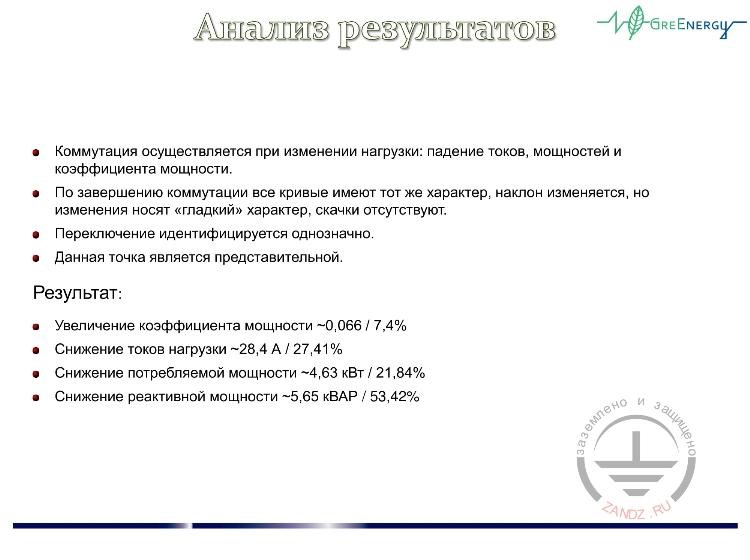
Коммутация осуществляется при изменении нагрузки: падение токов, мощностей и коэффициента мощности. |
Switching is done in case of the load change: drop of current, powers and power factor. |
|
По завершению коммутации все кривые имеют тот же характер, наклон изменяется, но изменения носят «гладкий» характер, скачки отсутствуют. |
Upon the end of switching all curves have similar pattern, the slope is changed, however, smoothly, without surges. |
|
Переключение идентифицируется однозначно. |
Switching is identified unambiguously. |
|
Данная точка является представительной. |
This point is representative. |
|
Результат: |
Result: |
|
Увеличение коэффициента мощности ~ 0,066 / 7,4% |
Power factor increase ~ 0.066 / 7.4% |
|
Снижение токов нагрузки ~28,4 А/ 27,41% |
Load current decrease ~28.4 А/ 27.41% |
|
Снижение потребляемой мощности ~4,63 кВт / 21,84% |
Consumed power decrease ~4.63 kW / 21.84 % |
|
Снижение реактивной мощности ~5,65 кВАР / 53,42% |
Reactive power decrease ~5.65 kVAR / 53.42% |
Analysis of the results. Switching when load changes
- Once again - switching is carried out at change, all this repeats itself. Thus, these points were analyzed.
|
Анализ результатов |
Analysis of the results |
|
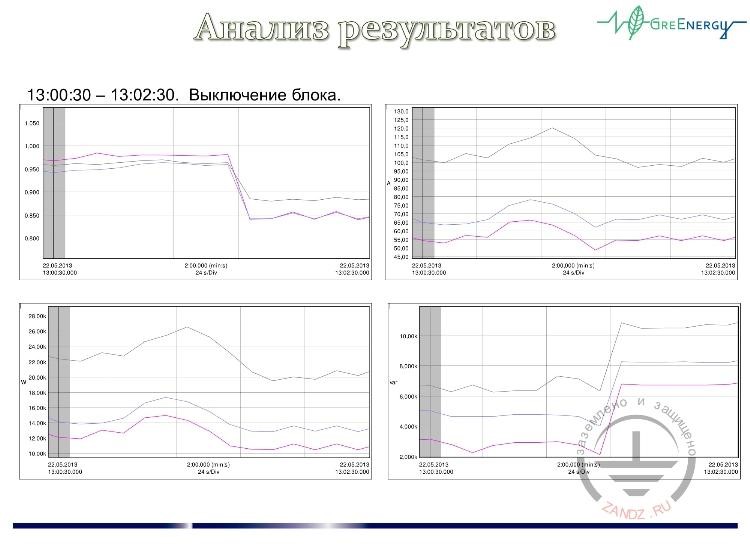
Выключение блока. |
Unit is turned Off. |
Analysis of the results. Unit switching off
- Can the point be considered representative? Let’s see. The currents are fairly smooth and the changes are small.
Changes before switching, they increase, after switching we have drop, that is, the point is representative.
|
Коммутация осуществляется при изменении нагрузки: падение токов, мощностей и коэффициента мощности. |
Switching is done in case of the load change: drop of current, powers and power factor. |
|
По завершению коммутации характер кривых изменяется. |
Upon the end of switching, the curves pattern is changed. |
|
Переключение по токам и потребляемой мощности идентифицируется не однозначно. |
Switching is hardly identified by the current and consumed power. |
|
Данная точка не может быть идентифицирована как представительная. |
This point cannot be identified as representative one. |
Analysis of the results. Change of the curve pattern
- The curve pattern changes. Switching on power consumption currents is not uniquely identified. Yes, quite a blurry picture, it is not clear, if the unit began to switch on or not. The point is not identified as representative.
|
Анализ результатов |
Analysis of the results |
|
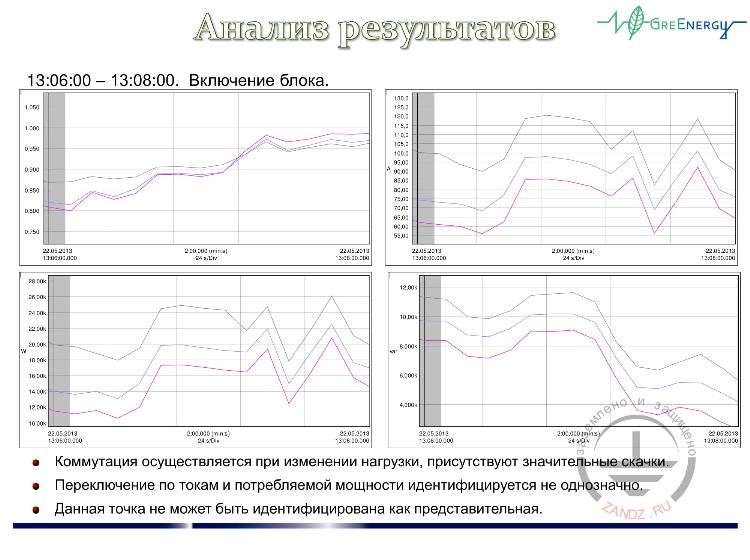
Включение блока. |
Unit is turned On. |
|
Коммутация осуществляется при изменении нагрузки, присутствуют значительные скачки. |
The switching is performed in case of the load change, with considerable surges. |
|
Переключение по токам и потребляемой мощности идентифицируется не однозначно. |
Switching is hardly identified by the current and consumed power. |
|
Данная точка не может быть идентифицирована как представительная. |
This point cannot be identified as representative one. |
Analysis of the results. Unit switching on (continued)
- Let’s go further. The same. Switching when the load changes, there are significant jumps. Switches consumed are not uniquely identified. The point is thrown out of consideration.
|
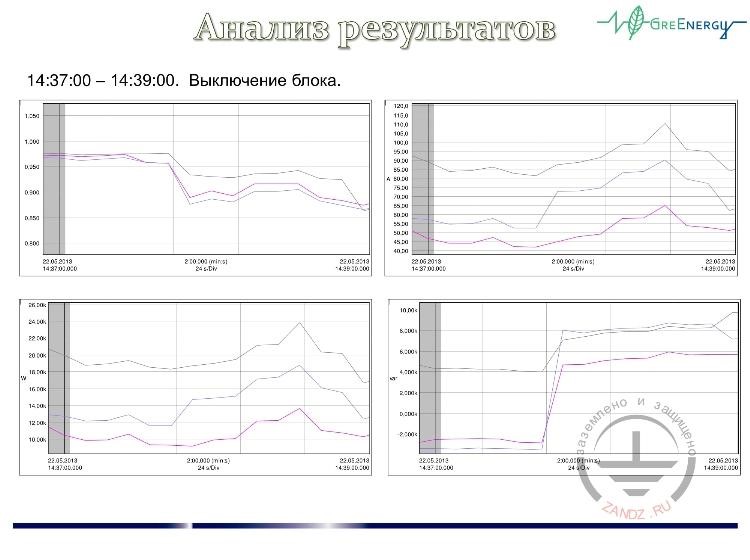
Выключение блока. |
Unit is turned Off. |
Analysis of the results. Unit switching off (continued)
- Then, concerning unit switching off. Here we have minor changes. Major or minor changes: minor.
If we look at our active power and reactive power, we have minor changes at the time of switching.
|
Анализ результатов |
Analysis of the results |
|
Изменения нагрузки при коммутации незначительны. |
Load change in case of switching is low. |
|
По завершению коммутации все кривые имеют тот же характер, наклон изменяется незначительно, на коротких интервалах изменениями можно пренебречь. |
Upon the end of switching all curves have the same pattern, the slope change is low, it can be ignored for the short intervals. |
|
Переключение идентифицируется однозначно. |
Switching is identified unambiguously. |
|
Данная точка является наиболее представительной - коммутация происходит практически на постоянной нагрузке. |
This point is the most representative - switching occurs under virtually continuous load. |
|
Результат: |
Result: |
|
Увеличение коэффициента мощности ~0,058 / 5,98% |
Power factor increase ~0.058 / 5.98% |
|
Снижение токов нагрузки -9,3 А /10,8% |
Load current decrease -9.3 А/ 10.8 % |
|
Снижение потребляемой мощности -1,42 кВт /10,76% |
Consumed power decrease -1.42 kW / 10.76 % |
|
Рекомендация |
Recommendation |
|
При нагрузках с высокой динамикой рекомендуется использовать более короткие интервалы и большее количество переключений. Это обеспечит большее количество представительных точек (переключение на практически постоянном характере нагрузки). |
In case of the loads with high dynamics it is recommended to use shorter intervals and higher number of switching. This will provide high number of representative points (switching under virtually continuous load). |
Analysis of the results. Inclination change
- The inclination changes slightly. Switches are definitely identified. Definitely - not definitely? Yes, quite clearly, there are no blurry characteristics, everything is absolutely clear. There was one reactive power, here is quite clearly the reactive power is different. This point is the most representative, switching takes place at almost constant load. Let’s analyze our characteristics, as they changed before and after switching, respectively. Therefore, here we recommend and preferably, if the customer does not twist your arms, use a 15-minute interval. We select the number of points we can use for analysis.

|
к вопросу использования стандартных средств учета (счетчики ЭЭ) |
as regards the use of standard instrumentation (electric energy meters) |
Use of standard accounting tools
- And now I would like to stop to keep it within 60 minutes. Concerning the question of using standard accounting tools, because the first thing that comes to the customer is that we deliver a day or two with or without a unit or an hour with a unit/hour without a unit and everything will be fine. We will all see now on the integral characteristics. Misconception in several illustrations that I would like to show you.
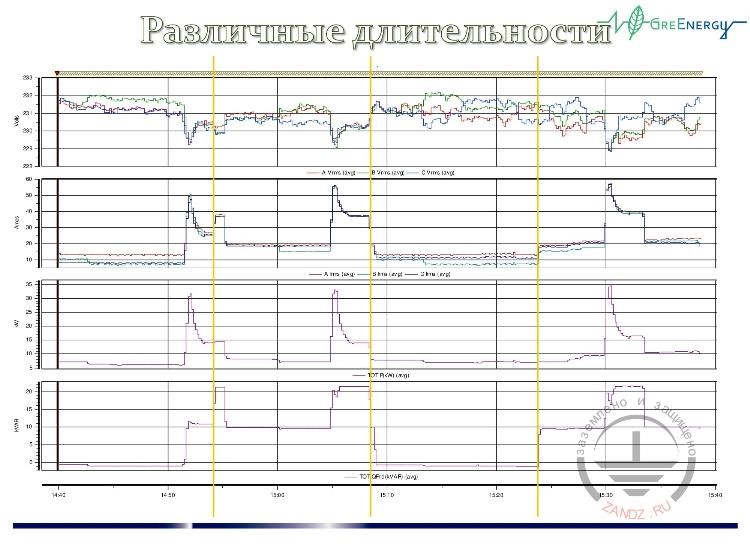
Different durations
- Mechanical section. Production of fixtures, imported equipment is used and the power engineer says: “It is quite clear, at least, at all intervals. And from interval to interval, nothing changes with me”. Moreover, it is good if it is face to face; it is worse if it is stated in the leadership of the decision maker when you have to prove the opposite later. Try to avoid such moments, because I try to spare people so that they do not talk nonsense in public, because they will have to be somehow responsible. I say: “Come on, put the analyzer and try it with our unit. Everything will be clear, everything will be visible”. Since the instruction was given, we begin to analyze, and what do we see? Yes, there really is a high consumption level, there is a low consumption level.
And the characteristics here are different, but not very different. If you look at the duty cycle of the equipment, that is, the on/off varies significantly, for the power engineer it was a discovery. Therefore, it would be good, of course, to consider the parameters of consumption not to stumble upon such things. Therefore, if we say that we will use meters. Here you have one interval with a meter.
|
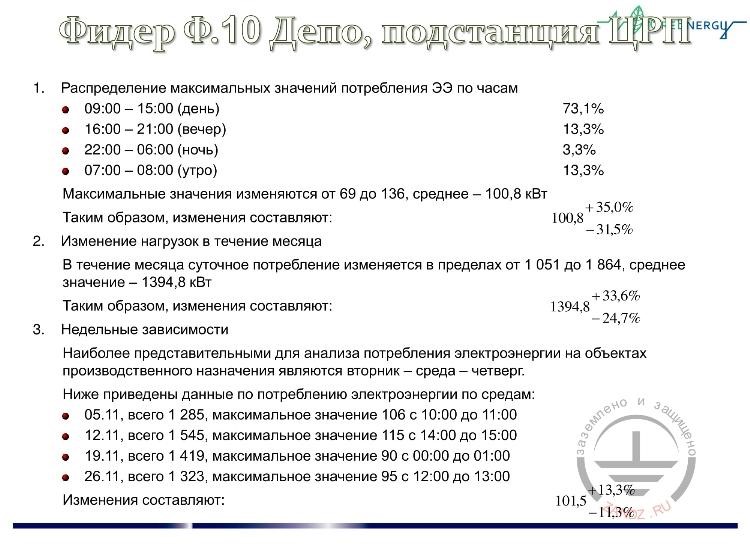
Фидер Ф.10 Депо, подстанция ЦРП |
Feeder F.10 Depot, central power distribution substation |
|
1. Распределение максимальных значений потребления ЭЭ по часам |
1. Distribution of the maximum power consumption values by hours |
|
09:00 - 15:00 (день) |
09:00 - 15:00 (day) |
|
16:00 -21:00 (вечер) |
16:00 -21:00 (evening) |
|
22:00-06:00 (ночь) |
22:00-06:00 (night) |
|
07:00 - 08:00 (утро) |
07:00 - 08:00 (morning) |
|
Максимальные значения изменяются от 69 до 136, среднее -100,8 кВт |
The maximum values change from 69 to 136, the medium is 100.8 kW |
|
Таким образом, изменения составляют: |
Therefore, the changes are following: |
|
2. Изменение нагрузок в течение месяца |
2. Load changes during the month |
|
В течение месяца суточное потребление изменяется в пределах от 1 051 до 1 864, среднее значение -1394.8 кВт |
24-hour consumption is changed during the month within the range from 1 051 to 1 864, average value is 1394.8 kW |
|
Таким образом, изменения составляют: |
Therefore, the changes are following: |
|
3. Недельные зависимости |
3. Week-basis relationships |
|
Наиболее представительными для анализа потребления электроэнергии на объектах производственного назначения являются вторник - среда - четверг. |
Tuesday - Wednesday - Thursday are the most representative for the power consumption analysis at the production sites. |
|
Ниже приведены данные по потреблению электроэнергии по средам: |
Wednesday power consumption data are given below: |
|
05.11, всего 1 285, максимальное значение 106 с 10:00 до 11:00 |
05.11, total of 1 285, the maximum value is 106 from 10:00 to 11:00 |
|
12.11, всего 1 545, максимальное значение 115с 14:00 до 15:00 |
12.11, total of 1 545, the maximum value is 115 from 14:00 to 15:00 |
|
19.11, всего 1 419, максимальное значение 90 с 00:00 до 01:00 |
19.11, total of 1 419, the maximum value is 90 from 00:00 to 01:00 |
|
26.11, всего 1 323, максимальное значение 95 с 12:00 до 13:00 |
26.11, total of 1 323, the maximum value is 95 from 12:00 to 13:00 |
|
Изменения составляют: |
The changes are: |
Feeder F.10 Depot, CDS
- Here you have the second interval, but it is required much earlier and the next interval starts here. That is, there will be a fairly large error, caused by the temporary characteristics of our hardware. This is not related to energy saving hardware. Because sometimes when choosing to harmonize a methodology, you have to take data that is native to an enterprise or organization in order to show and prove that we will work according to a methodology. We take the depot, the mechanical section, the central distribution substation. They requested data during the year, requested data for the month of November by the hour. There are no energy saving hardware. We are at the stage of harmonization of the methodology. What device we will use as a measuring unit, because you can use the analyzer, you can use the meter, and you can make a combination when the customer says: “Yes, let's do it with our analyzer, but we will control you with our fragmentation systems.” It is a normal approach, it has the right to exist. Now, if we look at what happened in November. Let’s analyze. How are the peaks distributed - maximum values? The peaks are distributed quite blurry. If we look at the changes, the average values make up a hundred, but deviations amount to 31% + 35%. Folks, we say that we will catch 10% - 12% - 16%. This is a very large dispersion. The error here can be quite substantial, you can put a bedside table instead of an energy-saving device, you can even light up the battery light even without wires and say that we have or don’t have a combination of these conditions. It may well be that without any wires and a drop in energy consumption. Let’s analyze changes in loads during the month. Changes during the month - 24% + 33%, that is, these are daily changes. Not working.
|
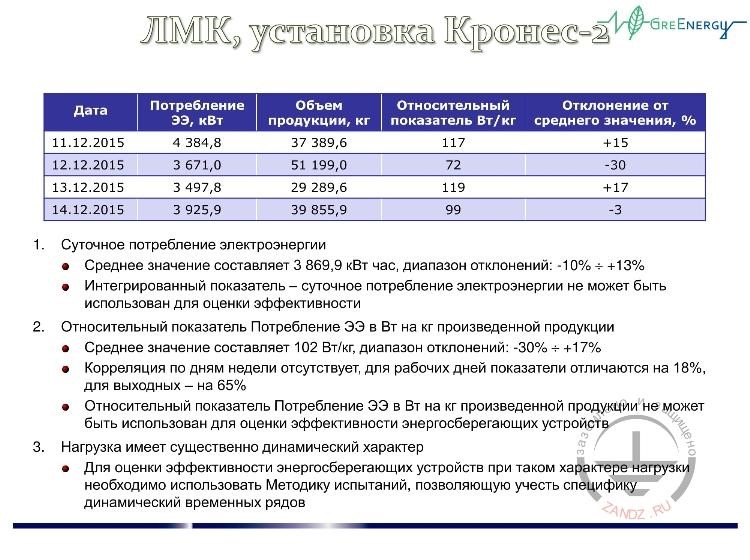
ЛМК, установка Кронес-2 |
LMK, Krones-2 installation |
|
Дата |
Date |
|
Потребление ЭЭ, кВт |
Electric energy consumption, kW |
|
Объем продукции, кг |
Production volume, kg |
|
Относительный показатель Вт/кг |
Relative indicator W/kg |
|
Отклонение от среднего значения, % |
Deviation from the average value, % |
|
1. Суточное потребление электроэнергии |
1. Daily power consumption |
|
Среднее значение составляет 3 869.9 кВт час, диапазон отклонений: -10% + +13% |
Average value is 3 869.9 kW hour, range of deviations: -10% + +13% |
|
Интегрированный показатель - суточное потребление электроэнергии не может быть использован для оценки эффективности |
Integrated indicator - daily power consumption cannot be used for the efficiency evaluation |
|
2. Относительный показатель Потребление ЭЭ в Вт на кг произведенной продукции |
2. Relative indicator Power consumption in W per kg of the finished products |
|
Среднее значение составляет 102 Вт/кг, диапазон отклонений: -30% + +17% |
Average deviation is 102 W / kg, range of deviations: -30% + +17% |
|
Корреляция по дням недели отсутствует, для рабочих дней показатели отличаются на 18%, для выходных - на 65% |
There is no correlation by the days of week, for the working days the indicators are differed by 18 %, for weekends these are differed by 65 %. |
|
Относительный показатель Потребление ЭЭ в Вт на кг произведенной продукции не может быть использован для оценки эффективности энергосберегающих устройств |
Relative indicator Power consumption in W per kg of the finished products cannot be used in the energy saving hardware efficiency evaluation |
|
3. Нагрузка имеет существенно динамический характер |
3. The load has a high dynamic pattern |
|
Для оценки эффективности энергосберегающих устройств при таком характере нагрузки необходимо использовать Методику испытаний, позволяющую учесть специфику динамических временных рядов |
One shall use the Test Methodology that allows consideration of the dynamic time series specifics in order to evaluate the energy saving hardware efficiency with the load pattern like that. |
LMK, Krones-2 installation
- Maybe, we should compare by weeks. When we have Saturday - Sunday, we take four weeks. We still have more than 10%. This means that it does not work, in this case it was decided by the customer that they approved the method. Another very interesting point is the power consumption. There is also a situation when people start saying that they are doing well. Let’s see. They say that they do not quite match by power, day by day, week to week, but the related indicators per unit of output, we have them in order. LNK is the Wimm-Bill-Dann company - a dairy plant. “Okay, let's see. How are we going to evaluate our parameters? Let’s see”. What have we done? We said that we would install the analyzer, agreed. We agreed that they give us the production program of the software installation so as not to mix the technological workshop. We took an isolated installation, not even a group, but one installation. And they tried to see what we do with our consumption and related units. Daily consumption - four days full measured. Daily consumption, range - 10%, + 13% - is not that high. The integrated indicator does not pass on the performance evaluation due to the analytical note, when you have to discuss the situation of approving the test procedure. The relative indicator - the average value of the relative indicator, that is, we have electricity consumption, that is, the volume of output from this installation is W/kg and of course the deviation. Deviation is 30% + 17%. The correlation from working days differs by 18%, for weekends by 65%.
They said that 24 hours a day, without change, nothing like on Sundays, they are different. The relative indicator can not be used, and since the load is of a significant dynamic nature, we have shown this, then in these cases, gentlemen, we ask you to agree on a methodology. The stage of the methodology approval, it can be quite long - it can be weeks, days, this is when a person reads, there is a document of pages 40 there. To say that he looked at it and understood how the results of the experiment will be processed, if within three days or less it just did not read and it is very bad. The person put the signature and does not understand what he signed. The situation is close to conflict and can actually lead to conflicts. The opposite situation, when it takes weeks and months, that is, you have to prove according to the customer, you have to prove and conduct tests, to show that it is possible to work only by this method. For example, we can say that it is enough to test this document. You can refer to, you can look at seals, approving the signature of the Government of Moscow, installed at their offices, these are Russian railways, etc. That is, the document has been approved, but its approval is a rather laborious and rather nervous stage. That is, those moments that in 60 minutes I wanted to dedicate to you - this is the most difficult moment, this is the procedure for the project implementation - once and this is confirmation of the results obtained during tests - two. Everything else - these are the developments that have already gone. Is it possible to use meters, by the way, to prove that the device is efficient?
It is, because the next topic of the webinar is the industry decision for oil and gas sector. And there I will show how we confirm our data using customer measurement tools. We also do this, but we do not do it during testing, as a rule, these are already operational solutions. It seems to be all. If you have any questions, I am ready to answer them.
Questions and Answers
- Question from Sergei Gennadievich Platov: “Sergei Anatolyevich, do I understand right that we will pay by the meter, and conclusion on savings shall be made according to the method?”
- Correct.
That is, we need to show and confirm the equipment efficiency, that is, if you want to get into confirming the equipment for a year or two, then we can use a meter. If we are talking about the fact that we have short-term test modes, then in this case we use the method. This process shall be agreed with the customer.
— The question by Sergei Gennadievich: “We save not in rubles, but in methodological units, right?”
— No. We save in kW of energy consumed. The method does not provide for any methodological units.
— The question by Sergei Gennadievich: "Active?"
- By active power - yes, we are talking only about active power. All our regulatory documents that the cosine should be no worse, why cosine, and not the power factor - I do not understand, but, nevertheless, there is more true even the tangent in terms of cosine should be no worse than 0.94. Otherwise, there are increasing ratios, fines, etc., and many such documents. No fines from what we have worked for 6 years at various enterprises in different regions. In fact, no one charges you any fines and there are no multiplying factors. We are talking only about active power in kW.
- Question from Ushakov Aleksey: “Please tell me, if ESH are effective at the facilities where the compensation of reactive power is obtained naturally without the power factor correction unit? Now many loads have negative reactive power (capacitive load) and as a result almost complete compensation occurs. Although many signs are not considered.
- It is impossible not to consider - it is wrong.
No, we do not recommend using ESH at capacitive active loads with a negative power factor. It shall be understood. I didn’t say anything nonsense, I said, and then I realized how it can be understood. The negative power factor, when viewed through the cosine, the cosine of the function is even, and there can be no negative sign. We just work with analyzers and in Europe, America, it is accepted that if we have an active capacitive load, then the power factor is negative.
- Sergei Anatolyevich, there are no further questions yet. Colleagues, if you have any questions after the webinar, please send to our email address and we will answer them. Now we may finish our webinar. Thank you for participation in our webinar. Sergei Anatolyevich, thank you for an excellent presentation. See you again!
- Thank you, colleagues! All the best!
<< Previous page
slides from 14 to 27
Related Articles:
 Webinar "Procedure for pilot projects", page 2


 Lightning Protection of Large Territories: Parks, Grounds, Plant Territories. Page 1
 Lightning Protection of Large Territories: Parks, Grounds, Plant Territories. Page 2
 Lightning Protection of Large Territories: Parks, Grounds, Plant Territories. Page 3